

Author: Shenglin Zhu, Networking Team, Alibaba
If you have ever waited on a physical SONiC testbed, you know the pain: hardware is scarce, test queues pile up, and a full regression can stretch across weeks. Testing is where SONiC’s promise meets reality: every new feature, ASIC, and topology must be proven before it touches production. This post shares how we turned vSONiC into a production-grade testing foundation, in two parts: a four-layer testing system, and an AI-assisted loop on top of it all.
What vSONiC actually is
vSONiC is SONiC running on KVM, where a chip emulator replaces the physical ASIC — and nothing else changes. Same kernel, same FRR protocol stack, same SONiC processes such as orchagent and syncd, and even the same SAI and vendor SDK code. The only difference is the data path: emulated instead of running on real silicon. That single property is the whole point — because the stack is identical, a test that passes on vSONiC carries straight over to hardware. In practice, a CI result on vSONiC is not a simulation to be re-confirmed on silicon; it is the result the hardware will produce, obtained earlier and in parallel.
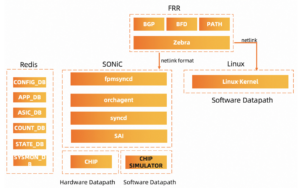
Figure 1 — vSONiC vs. hardware SONiC stack: identical everywhere except the data path (CHIP vs. CHIP SIMULATOR).
A four-layer testing system
Layer 1 — single-DUT. All community Ansible test suites run unchanged. We move the DUT inside the test server as a virtual DUT and use OVS bridges in place of FANOUT, so there is no FANOUT and no physical DUT — effectively unlimited parallel CI with zero extra hardware, across all community T0 and T1 topologies. We split cases by device role to run in parallel, and the same case can run on both vSONiC and real hardware for comparison. Because the virtual DUT is just a VM, a CI farm runs as many copies as its cores allow, so a regression that waited days for a free rack now drains overnight.
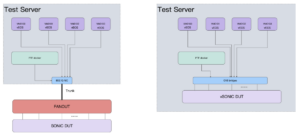
Figure 2 — Layer 1 wiring, before vs. after: physical DUT + FANOUT outside the test server (left) vs. everything inside the test server with OVS bridges and a vSONiC DUT (right).
Layer 2 — multi-node. A 7-node virtual topology built on sonic-mgmt for SRv6 testing: 3 PE and 4 P devices, all under test, with VPN and TE pytest cases already in the community. We added a software traffic generator in the PTF docker, with a mirror link per topology link, so we can verify SRv6 TE paths via per-link counters. This work is raised as a PR, not yet merged. Multi-node matters because some behaviors only appear across devices — route propagation, TE path selection, convergence — which a single-DUT rig cannot exercise.
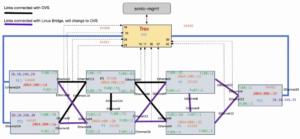
Figure 3 — Layer 2: 7-node SRv6 virtual topology (3 PE + 4 P) with a software traffic generator and per-link mirror links for TE path verification.
Layer 3 — 1:1 production emulation. We clone a live production fabric into vSONiC with the same topology, routes, and configs as the online devices — a scale no physical lab can reach — and use it as a pre-production gate: any configuration change is verified here before anyone touches an online device. Because the clone carries the real production configuration rather than a hand-written lab approximation, a change that would break the live network breaks here first, where fixing it is cheap.
Layer 4 — full 1:1 digital twin. We bring up the switches together with the control and monitoring components, all connected, to validate the path from a management command all the way down to execution on the switch — full-stack integration testing, config pre-verification, and outage reproduction in one environment. In a physical lab it is rarely feasible to wire switches to the real controllers and monitoring; in the twin those are just more VMs, so the integration surface finally becomes testable.
Together these layers catch three classes of defect a physical lab structurally misses: latent issues hidden in real production wiring and configs, which simplified lab topologies keep hidden until rollout; rare race conditions, because dozens of parallel instances multiply the odds of reproducing a one-in-a-thousand bug; and multi-component control-plane defects, because only in a digital twin is it easy to connect devices to controllers and monitoring.
What comes next: an AI-assisted loop
The most important next step is an AI-assisted loop on top of vSONiC. Triggered by a CI failure, it parses the job, analyzes the logs, diagnoses the issue, applies a code fix, compiles, brings up a testbed, and re-runs the regression — and if it still fails, it retries. Every step runs automatically, with no human in the loop until a merge decision is needed. The practical effect is that a failing pull request gets located, reproduced, fixed, and re-validated without waiting for an engineer to find a free testbed.
The goal is a one-hour end-to-end turnaround, from a failed CI job to a validated fix, and that goal only holds if every stage of the loop is fast. Three things make it possible. First, fast compilation: with Bazel, the whole vSONiC image builds in under 10 minutes, because Bazel’s dependency graph and remote caching rebuild only what an incremental change actually touched. Second, fast environment bring-up: the full vSONiC testbed — the VMs, the virtual DUT, the PTF docker, and the OVS bridges that interconnect them — comes up in about 20 minutes, and because it is entirely virtual we can spin up a fresh, clean one for every attempt. Third, fast regression: re-running all the cases for the failed job takes about 30 minutes, which is exactly why we split cases into separate jobs by device role — a failed job re-runs only its own slice, in parallel.
Add those three together and the loop closes inside an hour: diagnose, fix, compile, bring up, regress, and report. What used to be a day-long back-and-forth between a developer and a scarce physical lab becomes an automated cycle that keeps pull requests moving.
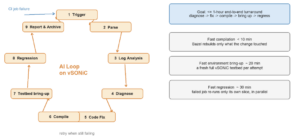
Figure 4 — The AI-assisted loop: a CI failure triggers parse, log analysis, diagnose, code fix, compile, testbed bring-up, regression, and report, retrying on failure; enabled by fast compilation (<10 min), fast bring-up (~20 min), and fast regression (~30 min).
A call to the community
At last I want to leave four asks. First, we would like to see the traffic-generator setup for the 7-node topology merged into the community. Second, let us speed up launching the vSONiC testbed — spinning up the VMs, DUT, PTF docker, and OVS bridges under sonic-mgmt can take tens of minutes today, and we should cut that together. Third, add the AI-assisted loop for failed PR tests, so everyone gets faster detection and higher merge efficiency. And fourth, the key enabler: any switch-ASIC vendor should provide a chip-simulator capability, because that simulator is the foundation that makes vSONiC — and all of this — possible.
Thank you to the SONiC community for the frameworks that make this work. I am always happy to collaborate — please reach out.
