
In this spotlight, we speak with Anirudh S, a senior at NIT Trichy, about his work designing and building shadowd, a native C++ analytics daemon that provides new observability, incident forensics, and analytics capabilities for SONiC switches.
About the Mentee
Anirudh is a senior at NIT Trichy with an interest in systems programming, infrastructure, and observability. Prior to joining the SONiC Mentorship Program, he had worked on infrastructure and systems projects involving technologies including Go and Kubernetes.
He joined the program looking for deeper, hands-on experience with how switch infrastructure operates—particularly how changes in Redis are detected by SONiC services, how the system reacts to those changes, and how telemetry is ultimately exported for operators.
Working directly in the SONiC codebase gave him an opportunity to explore the intersection of switch telemetry, incident response, alerting, and systems programming while gaining a much clearer understanding of how the components of a network operating system fit together.
Q: What project did you work on, and why is it important to SONiC?
My project was titled “Shadow Analytics of Redis Replica.”
SONiC keeps much of its operational state in Redis, including port status, counters, configuration, and neighbor state. That makes Redis a natural place to observe what is happening on a switch, but it also presented two challenges I wanted to address.
The first was an observability gap. When something goes wrong on a switch, there isn’t necessarily a lightweight, built-in way to capture the context leading up to an incident or turn a constant stream of state changes into meaningful alerts. Operators may have to reconstruct what happened afterward from raw logs and counters.
The second involved Redis availability and performance. SONiC performs some computation through Lua scripts running inside Redis. Because Redis is single-threaded, those scripts can block the main thread while they execute, potentially affecting other services that depend on Redis.
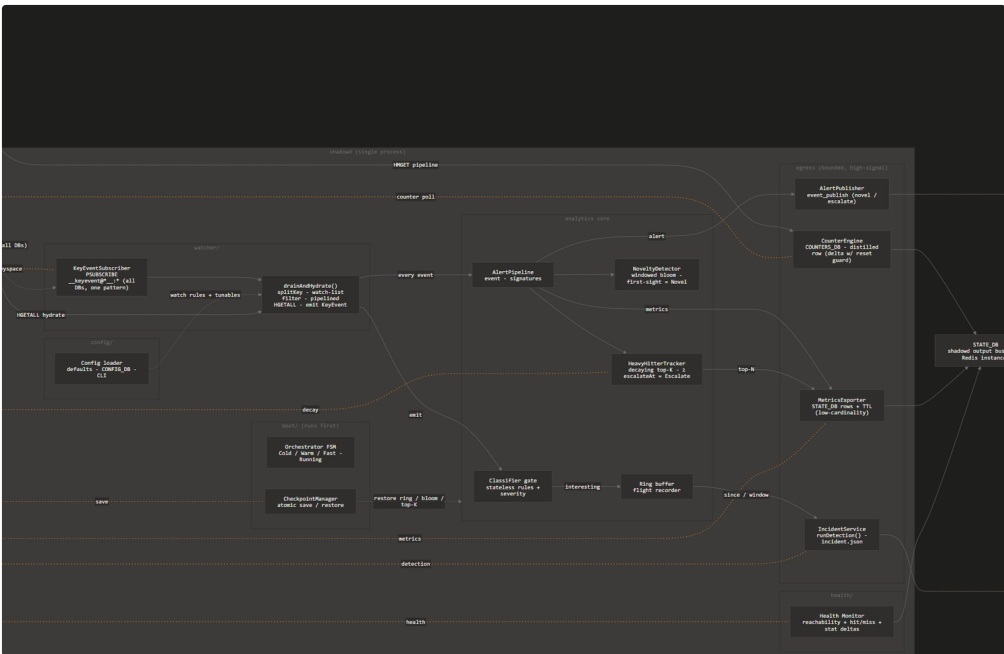
To address both challenges, I built shadowd, a standalone OpenTelemetry-style analytics daemon that runs alongside SONiC’s other processes. It acts as a pure observer: it subscribes to Redis keyspace notifications but never writes to the ASIC or APPL_DB.
On the observability side, shadowd provides two key capabilities:
- Incident forensics, capturing context around noteworthy events so operators can reconstruct what happened.
- Alert management, turning streams of state changes into meaningful, deduplicated alerts instead of raw noise.
Underneath those capabilities are mechanisms for novelty detection, heavy-hitter tracking, and a large ring buffer that maintains forensic history. I also implemented warm, fast, and cold boot semantics so those structures can be restored or rebuilt appropriately following a restart.
I also created an abstraction layer that allows read-only or lower-priority Lua computations to be ported to C++ and run inside shadowd on configurable polling intervals. This moves work away from the Redis hot path and helps keep the main Redis thread available.
This matters to SONiC because it demonstrates a clean, low-risk pattern for adding analytics to a switch. Because the daemon never mutates forwarding state, it can’t disrupt the dataplane but it can still surface high-value signals that operators actually care about. And by doing it in native C++ on , it fits the same performance and integration profile as the rest of the core stack.
Q: What were your main technical contributions?
The core of the work was architecting shadowd around a single swss::Select event loop.
Coming from a Go background, I initially thought about the architecture in terms similar to goroutines. In SONiC, however, the functionality needed to fit into the patterns provided by sonic-swss-common, using Selectables and SelectableTimer. Learning those patterns and designing the daemon in an idiomatic SONiC way was one of the most important parts of the project.
From there, I built out the main subsystems, including:
- Redis keyspace monitoring
- Alert management
- Incident forensics
- Boot detection
- Health reporting
- Configuration handling
- Metrics export
- Lua-to-C++ counter offload
For incident forensics and alerting, I used a large ring buffer to maintain history, a top-K map for heavy hitters, and a Bloom-filter-like structure for novelty detection.
One of the more challenging problems was ensuring that the state survived restarts reliably. I implemented atomic checkpointing so related structures are saved together as a consistent point-in-time snapshot. A small boot-state machine then determines whether a restart is warm, fast, or cold and decides which structures should be restored versus rebuilt.
The Lua-to-C++ offload capability was another major component. I designed it as a plug-and-play abstraction so read-only or lower-priority Lua computations can be expressed in C++, registered with shadowd, and run on configurable polling intervals rather than executing inside Redis.
For exporting the resulting signals, alerts can flow through SONiC’s eventd infrastructure, while derived metrics are written into STATE_DB and can be scraped into Prometheus through gNMI. More detailed state can also be exposed through STATE_DB reads and JSON dumps when an operator needs to investigate further.
Finally, I validated the system end-to-end using a virtual switch running in GNS3, generating live keyspace events by toggling ports and observing how the analytics pipeline reacted.
Q: What challenges did you face, and what did you learn?
Some of the earliest challenges came before I even began writing the daemon.
Compiling SONiC Debian components is resource-intensive and isn’t really designed for a typical laptop environment. My machine had 16 GB of RAM, and building sonic-swss-common would exhaust the available memory partway through the process. I eventually provisioned a 12 GB swap file to give the build enough headroom to complete.
It wasn’t a glamorous solution, but it taught me something important about systems development: sometimes the problem isn’t your code—it’s the environment you’re asking it to run in.
The development environment presented other challenges as well. I was working on Arch Linux, while SONiC is Debian-based, so the daemon had to build and run inside a Debian SONiC slave container. When package management inside the container created problems, I ended up manually extracting .deb packages and assembling the required dependencies.
On the daemon side, one of the biggest lessons was to validate each layer before building the next one. I got the export chain working and observed real data flowing before writing the daemon code that would feed it. I smoke-tested configuration before adding the CONFIG_DB layer. Every time I skipped that discipline, I ended up paying for it later.
I also learned how important it is to follow the conventions already established by sonic-swss-common. Rather than inventing a new way to communicate with Redis or configure Selectables, the best solution was usually to find the established SONiC pattern and follow it.
Q: What impact has this mentorship had, and what are your next steps?
This mentorship took me from reading SONiC’s code to actually contributing to a working daemon, and it gave me a much deeper understanding of how switch software fits together—from Redis keyspace events all the way through Prometheus and gNMI.
The daemon works end-to-end today, so my near-term focus is on making it more deeply integrated into SONiC. That includes authoring the YANG model needed for eventd-based alert export, packaging shadowd as a managed service, and adding a show command CLI plugin so operators can query analytics state directly.
Further out, I’d also like to add live configuration reload so tunable settings can be changed without restarting the daemon.
Longer term, I’m interested in contributing across the broader CNCF ecosystem. Within SONiC specifically, telemetry and exporting pathways are areas I find particularly interesting, and I’d like to continue contributing to sonic-gnmi and the external collector side of the ecosystem.
Q: Is there anyone you’d like to acknowledge?
This project has been an incredible learning experience and a real introduction to working with open source networking software.
I’d like to thank my mentors, Ravi Minnikanti and Ravindranath Kanakarajan, for their continuous guidance, technical direction, and patience throughout the project. Much of what I learned about doing things the “SONiC way” came directly from their mentorship.
I’d also like to thank the LFX team, especially Evan Harrison, for overseeing the program, making onboarding and logistics run smoothly, and supporting participants throughout the process.
Finally, thank you to the LFX Mentorship Program and the broader SONiC community for the opportunity and for creating such a welcoming environment for new contributors.
Get Involved
Interested in contributing to SONiC? Join the community and get involved through the SONiC wiki, mailing lists, working groups, and mentorship opportunities.